3. One from many technical aspects adding up for a top
excerpt
The Latest Red Flag - The Market's Rate Of Melting Up
Some more first derivative perspectives, this time focusing on the market's rate of change, via Financial Armageddon's Michael Panzner.
Based on data going back 90 years, whenever the 12-month rate of change (ROC) in the Dow Jones Industrials Average has exceeded 40 percent, it has generally signaled trouble ahead.
In three cases, a 12-month ROC above that level has only marked a short-term pause, after which the market traded higher.
But on 11 other occasions, similarly rapid advances have been followed by notable corrections, including the collapses that followed the 1929 and dot-com era peaks, as well as the 1987 crash.
Given those odds, increasingly exuberant bulls might want to have a rethink.
The Sox needs the final spike up to complete the 13 weekly count which should happen next week. the VIX has already completed its low and performs accordingly but as expected the manipulators are keeping the market for the quarter end. Apple is the big booster of the Tech area as it keeps outpacing all expectations for even the new product launch the coming week which might give a little boost to the Semi sector coming week. For 1 or 2 exceptions all bull runs came to an end or substantial coorection period after month 12-13 thats where we are now entering April and we will see hardly earnings surprises in the upcoming report season and stocks are already expensive even counting in the cheating of banks who are about 25% of the earnings. SOX should start a severe correction in the370-80 area with a magnitude of 10-20% at least in the first wave down.
2. I also understimated 2 things first the rule layed out by Livermore that a break of a big handle always creates a 'sure ' rally of 10-20% - worked for Apple. The second the demand for the IPAD as the sub 800$ notebook market gloabally is 120 mio and Apple might sell in its first year 10 mio units allthough its not a fullscale notebook comes as a surprise to me - have to check the ASTRO CHART OF APPLE.
EXCERPT
Apple to build 8-10M iPads in 2010, begins shipping preorders
As Apple began shipping the first iPads to those who first preordered, a new report on Monday said the company plans to ship between 8 million and 10 million devices in the 2010 calendar year.
In a new note to investors, analyst Katy Huberty with Morgan Stanley said suppliers for the iPad have currently forecast 2.5 million iPads to be shipped in the first three months of availability, from March to May. In all, Apple will ship between 8 million and 10 million by the end of 2010, suppliers said -- a number much higher than the previous expectation of 5 million.
Huberty said the upward revisions to iPad build rates "point to strong initial pre-orders." Every one million iPads shipped equates to roughly 25 cents of earnings per share. A strong iPad debut, she said, sets up for "significant earnings upside."
The consensus on Wall Street, she said, is that Apple will sell between 3 million and 4 million iPads in the product's first year. But supplier shipping projections suggest the Cupertino, Calif., company will exceed market expectations.
Jerking around with 1.2 mio temp workers for the Census which pushes the statistics lower but does not change the employment situation has become the clasic strategy of DC politics and that is not an Obama gimmick but rather professional/ criminal political cheating method. why do we give Obama special credit as he does the same thing Bush senior did with read my lips , who promised change ( so far he delivered a healthcare reform for a change but we have to see if that is for a better change still) and has not delivered anything but be a good puppet for the Rockefeller - Rothschild gang so far.
The Census aims to be every man’s hero. It promises an economic stimulus, a reduction in unemployment, and greater funds for every community. Of course, the reality is much closer to a game of musical chairs with your money. And guess who will be left standing?
The most immediate impact of the Census is that it distorts unemployment rates. With 1.2 million hired temporarily during the fall, the Census is already skewing the unemployment numbers in the government’s favor. Specifically, the fall data shows unemployment at 9.8% (Sept), 10.1% (Oct), and 10% (Nov).
Who can forget the hoopla over the November reduction from 10.1 to 10? To government officials, it was as if the clouds had parted after a relentless hurricane, “proof” that the massive stimulus spending was working.
This one-tenth-of-a-percent drop was exalted as the beginning of the end for the recession. Of course, a closer look at the numbers revealed that the decrease was largely explained by those leaving the workforce and dropping out of the government’s statistics. Similarly, the January drop from 10 percent to 9.7 percent was praised as a sign from the heavens, a sign that was subsequently tarnished by February’s slight increase in unemployment.
In an attempt to get a clearer picture of the effect from the Census on unemployment data, we evenly subtracted the 1.2-million Census bump across fall’s unemployment rates and found the new numbers ringing in at 10.1% (Sept), 10.4% (Oct), and 10.1% (Nov). If a one-tenth-of-a-percent drop in November was a reason to celebrate, then a three-tenth-of-a-percent October upward revision is a reason to cringe.
In the months ahead, expect the same number games.
The Census already hired 1.2 million workers in the fall, as mentioned earlier; now they’re planning for another 1.2 million in the spring. February began with an additional 15,000 Census workers; the hiring will peak in April-May with 800,000 workers hired in just two months. The peak alone is projected to temporarily push unemployment downward by half a percent.
Digging a bit deeper, we find that this year, 723,000 door-to-door Census takers will be needed in comparison to 2000’s 604,000, a 16.6 percent increase despite the lack of an equivalent rise in the population.
The hiring numbers are pushed upward by the low total working hours per employee. On average, each temporary Census employee will work 19 hours a week for six weeks. But “work” may not be the most appropriate word. The Census estimates that only 47.8 million houses will require a Census worker to visit. Divide this by 723,000 census takers to get 66 houses per worker. Since each temp will be employed for six weeks, this translates into less than two houses visited per workday.
The spending side of the Census equation doesn’t make much sense either. According to a Census Bureau press release, mailing back the form costs the government only 42 cents, while visiting a house costs 56 dollars.
Why does it cost 56 dollars to visit just one house! Even with repeat visits, this seems a lot. Imagine that pizza delivery were this expensive.
This wasted money will go toward boosting the GDP by 0.1% and 0.2% during Q1 and Q2, followed by equivalent declines in Q3 and Q4. Some parts of the country will get more than others, according to various pay rates. The Washington D.C. Census office offers $20 per hour, San Francisco $22, and Anchorage, Alaska, pays the most at $25 per hour. On the lower end, Tupelo, MS, pays $10.50; Beckley, WV, $10.75; El Paso, TX, $12.75 per hour.
With some exceptions, large metropolitan areas will receive higher pay rates.
And what about money allocated through Census data? The Census marketing campaign has claimed that filling out the Census will help your community. Certainly, in 2007, nearly $436 billion were redistributed through the aid of Census data. But helping the community might be stretching it – unless one considers welfare payments as “helping the community.” Examining the long list of programs reveals that little will help net taxpayers, other than road-building projects.
Government cannot improve one individual’s situation without taking away from another. Just as it does for any government program, this applies to money allocated by the Census. This helps the community about as much as mugging somebody on the street. Hey, someone in the community got the money, right?
Distortions in unemployment rates aren’t the only things in store this year. It’s time to tally up the dependents on the welfare state, redistribute some income, and fudge the economic numbers. All in a day’s work at the Census – or should I say, half a day’s work.
Zerohedge chart only represents part of the facts as you can see below for yourself. It is always smart to check both categories hence also the mini contract as they often weirdly enough ( might explain that in a later post) act as antagonists - meaning they act just opposite to the other contract. So it makes sense to net them both out to see the real thing. It is true that the big contract had a huge decrease regular contract on the short side for big speculators but for the same category we also had a huge decrease on the long side in the mini contract. The net effect big traders big contract was 66043 shorts terminated - on the other hand 192.914 net longs for big traders were terminated divided by 5 ( thats the factor between big and mini contarct ) 38583 in big contract terms. If you net out those 2 numbers we end up with 27.460 shorts being terminated for big traders which is not quite as big as zerohedge made it look - sorry for not double checking before I had it on my blog.
excerpt
S&P 500 STOCK INDEX - CHICAGO MERCANTILE EXCHANGE                    Code-138741
FUTURES ONLY POSITIONS AS OF 03/23/10                         |
--------------------------------------------------------------| NONREPORTABLE
     NON-COMMERCIAL      |   COMMERCIAL    |      TOTAL      |   POSITIONS
--------------------------|-----------------|-----------------|-----------------
 LONG  | SHORT  |SPREADS |  LONG  | SHORT  |  LONG  | SHORT  |  LONG  | SHORT
--------------------------------------------------------------------------------
(S&P 500 INDEX X $250.00)                            OPEN INTEREST:      309,880
COMMITMENTS
 23,525   29,729      317  208,848  212,900  232,690  242,946   77,190   66,934

CHANGES FROM 03/16/10 (CHANGE IN OPEN INTEREST:   -171,375)
 -1,342  -67,385   -7,081  -98,999  -86,508 -107,422 -160,974  -63,953  -10,401

PERCENT OF OPEN INTEREST FOR EACH CATEGORY OF TRADERS
    7.6      9.6      0.1     67.4     68.7     75.1     78.4     24.9     21.6

NUMBER OF TRADERS IN EACH CATEGORY (TOTAL TRADERS:      129)
     17       19        4       57       57       76       78
E-MINI S&P 500 STOCK INDEX - CHICAGO MERCANTILE EXCHANGE             Code-13874A
FUTURES ONLY POSITIONS AS OF 03/23/10                         |
--------------------------------------------------------------| NONREPORTABLE
     NON-COMMERCIAL      |   COMMERCIAL    |      TOTAL      |   POSITIONS
--------------------------|-----------------|-----------------|-----------------
 LONG  | SHORT  |SPREADS |  LONG  | SHORT  |  LONG  | SHORT  |  LONG  | SHORT
--------------------------------------------------------------------------------
($50 X S&P 500 INDEX)                                OPEN INTEREST:    2,348,917
COMMITMENTS
351,567  375,215   25,940  1644247  1710373  2021754  2111528  327,163  237,389

CHANGES FROM 03/16/10 (CHANGE IN OPEN INTEREST: -1,229,912)
-349,979 -157,065  -25,589 -768,207 -719,729 -1143775 -902,383  -86,137 -327,529

PERCENT OF OPEN INTEREST FOR EACH CATEGORY OF TRADERS
   15.0     16.0      1.1     70.0     72.8     86.1     89.9     13.9     10.1

NUMBER OF TRADERS IN EACH CATEGORY (TOTAL TRADERS:      451)
    103      100       31      136      172      253      289
Probably someone disliked the offer uf Dubai on its febt repayment - in any case this is not a coincidence or an accident. I am very curious what explanation the surviving pilot has to offer if we ever get to hear that.
Mar 26, 2010 – 10:04 – WAM Abu Dhabi, 26th March 2010 (WAM) — A sailplane carrying H.H. Sheikh Ahmed bin Zayed Al Nahyan, Chairman of the Board of Trustees of the Zayed Foundation for Charity and Humanitarian Works and Managing Director of Abu Dhabi Investment Authority, has crashed on a lake in Morocco.
The pilot was rescued and he is in a good condition but search is still on for Sheikh Ahmed.
Abu Dhabi Investment Authority Managing Director Sheikh Ahmed bin Zayed Al Nahyan was missing after a glider he was in crashed into a lake in Morocco, the official Emirates News Agency reported.
The pilot of the sailplane was rescued and is in good condition, the state-run news service said, adding that the search for Sheikh Ahmed was continuing. The glider went down near Morocco’s capital Rabat March 26, according to the official Moroccan MAP news agency.
ADIA is one of the world’s largest sovereign wealth funds and managed an estimated $328 billion at the end of 2008, according to economists at the New York-based Council on Foreign Relations. Abu Dhabi possesses about 8 percent of the world’s oil supply.
Calls to the Investment Authority yesterday, the final day of the weekend in Abu Dhabi, weren’t answered. Neither news service provided further details.
Sheikh Ahmed is a younger brother of Abu Dhabi ruler and president of the United Arab Emirates Sheikh Khalifa bin Zayed. He took charge of ADIA in 1997, according to a BusinessWeek profile in 2008. The 41-year-old ranked No. 27 on the Forbes list of most powerful people last year. He’s also chairman of Zayed Bin Sultan Al Nahayan Charitable and Humanitarian Foundation.
Estimates of ADIA’s assets range from $300 billion to $800 billion. Sheikh Ahmed in a January interview with Handelsblatt declined to comment on the size of the fund, though he cited Abu Dhabi’s ruler as saying that the highest estimates were exaggerated. The fund’s global investments range from real estate to finance and hospitality.
———-
this to me is a huge story and he is dead, the original story broke on the 26th but most mainstream is only picking it up now, so its also another little incident on the 26th of march along with the south korean ship sinking..this guy is not of the peasant variety..he is top shelf wealth..whats the connection to dubai? is this a hit on the family?..by who?..how did the pilot live when the shaikh didnt? whats the fallout if the uae suspects foul play?..is it payback for the “mossad” incident..or is it another source…lots of questions..something doesnt sound right with the pilot escaping unhurt and they cant find a body..maybe hes gone underground and faked his death because his fund is bankrupt?
a sailplane?..changed to a glider..whatever it was it sounds light and flimsy..
check out this discussion about timewave and march 26, we have 2 incidents now that are puzzles..the south korean ship and the shaik that occured on the 26th :
The rejection of the purchase triggered the bribbing scandal as it is a regular part of China dealings to be or get bribbed - on the other hand on what part of the world its not - Daimler and Siemens just had to pay hugh fines for doing so in America.We are in the early stage of a gloabl cold war of economics - which will also spills more and more on the political platform soon as the Remibi valuation theme is just one playground or Google another.
excerpt 1
Mining Giant Scraps China Deal
SHANGHAI — The Chinese government’s largest investment ever in a Western company, a proposed $19.5 billion stake in the Australian-British mining giant Rio Tinto Group, collapsed early Friday, dealing a blow both to China’s global corporate ambitions and to its efforts to gain clout in the natural resources market.
The board of Rio Tinto announced the decision after meeting in London on Thursday, saying the company had ended the deal it struck in February to sell the stake to China’s state-owned Aluminum Corporation of China, also known as Chinalco.
The board said in a statement early Friday that it had ended the deal with Chinalco and would raise about $20 billion by issuing new stock and forming a joint venture with its longtime rival, the Australian mining giant BHP Billiton, the world's largest mining company.
The China deal, which would have effectively expanded Chinalco’s existing 9.3 percent stake in Rio to 18.5 percent, had drawn stiff political opposition in Australia, where mineral riches have fueled the country’s prosperity and where some have begun to fear China’s power in the region. Institutional investors have also expressed skepticism about the agreement, with some calling it a sweetheart deal for the Beijing government.
Rio Tinto Group, the third-largest mining company, spied on China’s steel mills for six years, creating 700 billion yuan ($102 billion) in excess charges for iron ore, a report on a Chinese government-run Web site said.
Government agencies should enhance surveillance of the secret-protection work at key companies they supervise, said the article posted yesterday on http://www.baomi.org, which is affiliated with the National Administration for the Protection of State Secrets.
China, destination for half the $52 billion global seaborne trade in iron ore, has detained four members of Rio’s Shanghai team, including Australian Stern Hu, on charges they stole state secrets. The detentions have strained relations between China and Australia and followed Rio’s abandoning of a $19.5 billion deal with Aluminum Corp. of China four months after agreeing to what would have been China’s biggest overseas investment.
“That means China gave the employer of those economic spies more than $100 billion for free, which is about 10 percent of Australia’s GDP,” the article said. “It also caused the serious consequence of climbing losses in China’s pillar industry of steelmaking.”
Hu and three other executives of London-based Rio were detained by Chinese authorities on July 5 for allegedly stealing state secrets and actions that harmed the nation’s economic interests and security. Australia, which has said the detentions may be connected to annual price talks for iron ore, is seeking more information and has urged China to deal with the case expeditiously.
‘Without Foundation”
Rio Tinto’s Melbourne-based spokeswoman Amanda Buckley declined to comment on the report today, referring to a July 17 statement. The allegations in media reports “that employees were involved in bribery of officials at Chinese steel mills are wholly without foundation,” Sam Walsh, head of Rio Tinto’s iron ore unit, said that day. Rio, listed in London and Australia, has a third of its assets in Australia.
“This is another step forward and we are moving toward the Rio employees being charged,” said Michael McKinley, a professor of global politics at Australian National University in Canberra. “History tells us that if someone is charged, there is a strong prime facie case and they will most likely be found guilty.”
Australian Prime Minister Kevin Rudd told reporters July 15 that the world was “watching closely” how China handled the Hu case. China is the world’s largest buyer of iron ore and Australia’s second-biggest trading partner, with two-way trade valued at A$68 billion ($57 billion) in 2008.
The Web site is operated by the Gold Wall Press, which is administered by the Secrets Office of the Communist Party of China’s Central Committee, according to an introduction on the Web site. The article’s author is Jiang Ruqin, the Web site said, without providing further information.
“The case will still take some time,” McKinley said, “and China has a different definition of national security.”
this is starting to become a huge problem for china and australia..100 billion is a lot of loot..take note these are only allegations at this stage..but after seeing what happened to a chinese boss last week who was on the grift..he lost his life..stern would be a reasonably worried man i reckon..and where does this put on going relations for rio and all the other iron ore exporters in australia?
Leaked by someone in the State Department in 2006, they show how the U.S. plans to reshape the region through their various WARS, INVASIONS, and REVOLUTIONS. First carried by the website globalresearch.ca, they have since been REMOVED.
The term “New Middle East” was introduced to the world in June 2006 in Tel Aviv by U.S. Secretary of State Condoleezza Rice (who was credited by the Western media for coining the term) in replacement of the older and more imposing term, the “Greater Middle East.”
This shift in foreign policy phraseology coincided with the inauguration of the Baku-Tbilisi-Ceyhan (BTC) Oil Terminal in the Eastern Mediterranean. The term and conceptualization of the “New Middle East,” was subsequently heralded by the U.S. Secretary of State and the Israeli Prime Minister at the height of the Anglo-American sponsored Israeli siege of Lebanon. Prime Minister Olmert and Secretary Rice had informed the international media that a project for a “New Middle East” was being launched from Lebanon.
This announcement was a confirmation of an Anglo-American-Israeli “military roadmap” in the Middle East. This project, which has been in the planning stages for several years, consists in creating an arc of instability, chaos, and violence extending from Lebanon, Palestine, and Syria to Iraq, the Persian Gulf, Iran, and the borders of NATO-garrisoned Afghanistan.
The “New Middle East” project was introduced publicly by Washington and Tel Aviv with the expectation that Lebanon would be the pressure point for realigning the whole Middle East and thereby unleashing the forces of “constructive chaos.” This “constructive chaos” –which generates conditions of violence and warfare throughout the region– would in turn be used so that the United States, Britain, and Israel could redraw the map of the Middle East in accordance with their geo-strategic needs and objectives.
U.S. Secretary of State Condoleezza Rice’s speech on the “New Middle East” had set the stage. The Israeli attacks on Lebanon –which had been fully endorsed by Washington and London– have further compromised and validated the existence of the geo-strategic objectives of the United States, Britain, and Israel. According to Professor Mark Levine the “neo-liberal globalizers and neo-conservatives, and ultimately the Bush Administration, would latch on to creative destruction as a way of describing the process by which they hoped to create their new world orders,” and that “creative destruction [in] the United States was, in the words of neo-conservative philosopher and Bush adviser Michael Ledeen, ‘an awesome revolutionary force’ for (…) creative destruction…”2
Anglo-American occupied Iraq, particularly Iraqi Kurdistan, seems to be the preparatory ground for the balkanization (division) and finlandization (pacification) of the Middle East. Already the legislative framework, under the Iraqi Parliament and the name of Iraqi federalization, for the partition of Iraq into three portions is being drawn out. (See map below)
Moreover, the Anglo-American military roadmap appears to be vying an entry into Central Asia via the Middle East. The Middle East, Afghanistan, and Pakistan are stepping stones for extending U.S. influence into the former Soviet Union and the ex-Soviet Republics of Central Asia. The Middle East is to some extent the southern tier of Central Asia. Central Asia in turn is also termed as “Russia’s Southern Tier” or the Russian “Near Abroad.”
Many Russian and Central Asian scholars, military planners, strategists, security advisors, economists, and politicians consider Central Asia (“Russia’s Southern Tier”) to be the vulnerable and “soft under-belly” of the Russian Federation.3
It should be noted that in his book, The Grand Chessboard: American Primacy and Its Geo-strategic Imperatives, Zbigniew Brzezinski, a former U.S. National Security Advisor, alluded to the modern Middle East as a control lever of an area he, Brzezinski, calls the Eurasian Balkans. The Eurasian Balkans consists of the Caucasus (Georgia, the Republic of Azerbaijan, and Armenia) and Central Asia (Kazakhstan, Uzbekistan, Kyrgyzstan, Tajikistan, Turkmenistan, Afghanistan, and Tajikistan) and to some extent both Iran and Turkey. Iran and Turkey both form the northernmost tiers of the Middle East (excluding the Caucasus4) that edge into Europe and the former Soviet Union.
This map of the “New Middle East” seems to be based on several other maps, including older maps of potential boundaries in the Middle East extending back to the era of U.S. President Woodrow Wilson and World War I. This map is showcased and presented as the brainchild of retired Lieutenant-Colonel (U.S. Army) Ralph Peters, who believes the redesigned borders contained in the map will fundamentally solve the problems of the contemporary Middle East.
The map of the “New Middle East” was a key element in the retired Lieutenant-Colonel’s book, Never Quit the Fight, which was released to the public on July 10, 2006. This map of a redrawn Middle East was also published, under the title of Blood Borders: How a better Middle East would look, in the U.S. military’s Armed Forces Journal with commentary from Ralph Peters.5
It should be noted that Lieutenant-Colonel Peters was last posted to the Office of the Deputy Chief of Staff for Intelligence, within the U.S. Defence Department, and has been one of the Pentagon’s foremost authors with numerous essays on strategy for military journals and U.S. foreign policy.
It has been written that Ralph Peters’ “four previous books on strategy have been highly influential in government and military circles,” but one can be pardoned for asking if in fact quite the opposite could be taking place. Could it be Lieutenant-Colonel Peters is revealing and putting forward what Washington D.C. and its strategic planners have anticipated for the Middle East?
The concept of a redrawn Middle East has been presented as a “humanitarian” and “righteous” arrangement that would benefit the people(s) of the Middle East and its peripheral regions.
If one analysis Turkey astro chart you will find a Pluto Mars square - which is the most agressive pattern you can probably have and they have a Venus Jupiter conjunction in the sign Scorpio which adds a lot of energy to this warrior attitude. Within the next 2 years this will be activated through Pluto moving into a square to Mars therby activating the natal square - in plain words the likelyhood of war is very high. Basically Obama has positioned massiv troops on both sides of Iran preparing for a surgical stike probably at the same time the CIA will support the opposition in Iran and weaken the support of the government as their retaliation activities are supposed to win more sympathies against the rulers of Iran. Yesterday ms Merkel visited Turkey and she seems to be a miserable politician/ diplomat as she had in several interviews prior to her visit stated that a full member ship is not an option for her. Well oriantal hospitality has its own rules one is that a guest may come with a present but what she did was rather an offense and a gravedeep mistake as she seems to lack the intelligence that the PM of Turkey is playing her as he does not have serious ambitions to join the EU ( which is anyway bankrupt). Rather her rejection gives him a joker to play a different agenda- she should never play poker as she buys any bluff. More importantely the Turkish PM said in an interview with the German magazine "Spiegel", that he does not want any nuclear weapons in this area and referred to an open secret - that Israel has nuclear weapons - without saying the name.
Sentiment is at the right spot for a top and ISE options MA's have also reached a neutral to bullish level with today around 1.50 for now. Good was that we started the week with an upside gap as well which is the better start for a top scenario anyway. Now we are in the quarterly legal market manipulation called window dressing- although these days its one big manipulation with a Ponzi character and the government is part of the scam.
excerpt
MONDAY, MARCH 29, 2010
INVESTOR SENTIMENT READINGS
High bullish readings in the Consensus stock index or in the Market Vane stock index usually are signs of Market tops; low ones, market bottoms.
Historical data available at (800) 383-1441. editor@consensus-inc.com
AAII Index
Bullish
32.4%
35.4%
45.3%
Bearish
34.7
29.9
25.3
Neutral
33.0
34.8
29.4
Source: American Association of Individual Investors,
625 N. Michigan Ave., Chicago, Ill. 60611 (312) 280-0170.
Market Vane
Bullish Consensus
57%
57%
56%
Source: Market Vane, P.O. Box 90490,
Pasadena, CA 91109 (626) 395-7436.
FC Market Sentiment
Indicator
56.5%
57.1%
58.4%
Source: First Coverage 260 Franklin St., Suite 900
Boston, MA 02110-3112 (617) 303-0180. info@firstcoverage.com
FC Market Sentiment is a proprietary indicator derived from actionable sell-side trade ideas sent by the sell-side to their buy-side clients over the First Coverage platform. Over 1,000 institutional sales people at more than 250 firms participate on the First Coverage platform and have contributed hundreds of thousands of ideas since inception. Each Idea is associated with a ticker or sector and is tagged bullish or bearish by the creator. This data is aggregated at the sector, industry and market level. The FC Market Sentiment score ranges from 0-100 (0=most bearish, 50=neutral, and 100=most bullish) and represents a completely objective, real-time view into what advice the sell-side is providing to their buy-side clients
Part of a top and low are events like the one described below and as we are rather close to a top this confirms our assumption. The fact that it was executed By Goldman gives a special flavor to it but its rather not a trading account as they would trade the small contracts. My guess a pension fund is taken away a hedge since a 19 bil. bet would be too big for any hedge fund.
excerpt
Capitulation: Biggest Weekly Spike In S&P Large Contracts On The CFTC In History - $19 Billion In Index Shorts Covered
Submitted by Tyler Durden on 03/28/2010 21:34 -0500
This is what capitulation looks like:
The chart above is an indication of the net speculative contracts on the CFTC as disclosed by the weekly COT report. In particular, this tracks the S&P Large contracts (x 250). Last week saw the single biggest weekly short cover in the history of this data set, indicating one of several things: 1) some large fund(s) capitulated and covered a major short position, 2) the ongoing forced short buy-ins by the State Streets of the world have finally yielded results, 3) someone is positioning for a massive move higher in the market by going net short to neutral. The net weekly change in contracts of 66,043 is a record, and involves a staggering amount of capital: the money involved is 1,150x250x66,000 or roughly $19 billion. A weekly move of this magnitude was only ever seen once before, on March 24, 2009, when the government had to cement the bottom of the market following the 666 low. As the Large uses Open Outcry, it explains why we were getting numerous emails from pit traders indicating that Goldman was buying up billions worth of S&P Large.
A comparison of the SPY and the weekly change in the S&P Large contracts can be seen on the next chart.
This can even be bigger than subprime - I need to check the numbers but it easily will be in the trillions. In any case its a scam which can bring down the global financial system without any chance of the FED or whom ever to fix it.
excerpt
Former Goldman Commodities Research Analyst Confirms LMBA OTC Gold Market Is "Paper Gold" Ponzi
Submitted by Tyler Durden on 03/28/2010 12:47 -0500
When we put up a link to last week's CFTC hearing webcast little did we know that it would end up being the veritable (physical) gold mine (no pun intended) of information about what really transpires in the commodities market. First, we obtained direct evidence from Andrew Maguire (who may or may not have been the target of an attempt at "bodily harm" as reported yesterday) of extensive manipulation in the silver market. Today, Adrian Douglas, director of GATA, adds to the mountain of evidence that the commodities market, and the CFTC, stand behind what is potentially the biggest market manipulation scheme in the history of capital markets (we are assuming for the time being that all allegations of the Fed manipulating the broader equity and credit markets are completely baseless). Using the testimony of a clueless Jeffrey Christian, formerly a staffer at the Commodities Research Group in the Goldman Sachs Investment Research Department and now head and founder of the CPM Group, Douglas confirms that the "LBMA trades over 100 times the amount of gold it actually has to back the trades."
Christian, who describes himself as "one of the world’s foremost authorities on the markets for precious metals" yet, in the words of Gary Gensler, said "that the bullion banks had large shorts to hedge themselves selling elsewhere- how do you short something to cover a sale, I didn’t quite follow that?" and proves that current and former Goldman bankers are some of the most arrogant people alive, assuming that everyone else is an idiot and will buy whatever explanation is presented just because the CV says Goldman Sachs. Yet Christian confirms that the gold market is basically a ponzi: "in the “physical market” as the market uses that term, there is much more metal than that…there is a hundred times what there is." And there you have it: as Douglas eloquently summarizes: "the giant Ponzi trading of gold ledger entries can be sustained only if there is never a liquidity crisis in the REAL physical market. If someone asks for gold and there isn’t any the default would trigger the biggest “bank run” and default in history. This is, of course, why the Central Banks lease their gold or sell it outright to the bullion banks when they are squeezed by high demand for REAL physical gold that can not be met from their own stocks" and concludes "Almost every day we hear of a new financial fraud that has been exposed. The gold and silver market fraud is likely to be bigger than all of them. Investors in their droves, who have purchased gold in good faith in “unallocated accounts”, are going to demand delivery of their metal. They will then discover that there is only one ounce for every one hundred ounces claimed. They will find out they are “unsecured creditors”.
For those of you who missed the CFTC hearing, here are two of the must-watch clips. In the first one, Adrian Douglas introduces the underlying concerns about the Ponzi nature of the LBMA hedging situation, in which a wholesale rush to "physical delivery" would result in a one hundred fold dilution of gold holdings, and a 99% result of unsecured creditor claims (good luck collecting on that particular bankruptcy). We also meet Jeffrey Christian, formerly of Goldman and currently of CPM, in which not only does the "expert" state that a bullion bank short is hedged by further shorting, but confirms Douglas' and GATA's previous claims that the "physical" market, as defined, is a joke, as the OTC market treats gold purely as a financial asset, essentially conforming to the precepts of fractional reserve banking. As Douglas notes "He confirms that the LBMA trades hundreds of times the real underlying physical. This is even a higher estimate than I have previously made! It is, as I asserted before the Commission, a giant Ponzi Scheme."
Here is running commentary from Douglas based on a transcript of this part of the hearing:
S. O’MALIA: Both Mr. Organ and Mr. Epstein in the second panel, raised the concerns that short positions exceed the physical supply. The second panel kind of argued that that wasn’t a concern. Are you concerned that the shorts will not be able to deliver if called upon?
J. CHRISTIAN: No. I am not at all concerned. For one thing it has been persistently that way for decades. Another thing is that there are any number of mechanisms allowing for cash settlements and problems and a third thing is as many people who are actually knowledgeable about the silver market and the gold market have testified today that almost all of those short positions are in fact hedges, the short futures positions are hedges, offsetting long positions in the OTC market. So I don’t really see a concern there.
[Note: It is interesting that Mr. Christian is not concerned about the ability of the shorts to deliver because they can cash settle! He clearly has no understanding that when someone wants to buy precious metals giving them cash instead is a failure to deliver. It is a default! But he is not concerned! He says that the short position is actually hedged by a long position on the OTC but we will see later in this testimony how he describes the “OTC Physical Market” and we will see that the long position is not bullion but is in fact an unbacked (or only partially backed) I.O.U. bullion.]
S. O’MALIA: Mr Organ would you like to respond?
H. Organ: I do see a risk on this, and I think it is a risk that we have to be very, very careful of. As countries like China, South Korea and Russia start demanding and taking physical delivery of their gold and moving it offshore to their shores and putting pressure on the Comex, and we will probably come to a point in time where we will have a failure to deliver.
A DOUGLAS: Mr. Chairman, could I make a comment?
CHAIRMAN GENSLER: No! Who are you?
A DOUGLAS: I would…
CHAIRMAN GENSLER: No! I said “No!”
A DOUGLAS: Oh! You said “No”?
CHAIRMAN GENSLER: I don’t know who is this?
A DOUGLAS: I am Adrian Douglas; I am assisting Harvey.
CHAIRMAN GENSLER: Alright, Sir. Yes.
A DOUGLAS: I would just like to make a comment. We are talking about the futures market hedging the physical market. But if we look at the physical market,the LBMA, it trades 20 million ozs of gold per day on a net basis which is 22 billion dollars. That’s 5.4 Trillion dollars per year. That is half the size of the US economy. If you take the gross amount it is about one and a half times the US economy; that is not trading 100% backed metal; it’s trading on a fractional reserve basis. And you can tell that from the LBMA’s website because they trade in “unallocated” accounts. And if you look at their definition of an “unallocated account” they say that you are an “unsecured creditor”. Well, if it’s “unallocated” and you buy one hundred tonnes of gold even if you don’t have the serial numbers you should still have one hundred tonnes of gold, so how can you be an unsecured creditor? Well, that’s because its fractional reserve accounting, and you can’t trade that much gold, it doesn’t exist in the world. So the people who are hedging these positions on the LBMA, it’s essentially paper hedging paper. Bart Chilton uses the expression “Stop the Ponzimonium” and this is a Ponzi Scheme. Because gold is a unique commodity and people have mentioned this, it is left in the vaults and it is not consumed. So this means that most people trust the bullion banks to hold their gold and they trade it on a ledger entry. So one of the issues we have got to address here is the size of the LBMA and the OTC markets because of the positions which are supposedly backing these positions which are hedges, but it is essentially paper backing paper.
[8 seconds of silence]
CHAIRMAN GENSLER: Oh! I guess I get time. Errr…Umm. I don’t have any other questions. Commissioner Dunn.
M. DUNN: I appreciate the difficulty of trying to do this by remote but at the end of your testimony you start talking about bona fide hedge exemptions for commercial traders and must be part of position limits and not to grant hedge exemptions to swap dealers would be devastating for liquidity of exchanges and the price discovery capacity, and we got into who determines what is legitimate, but could you amplify on that a bit and what you see as a danger there?
J. CHRISTIAN: Yes I can amplify on it; but amplify on it a bit is more difficult because it is a very big subject. The first thing is that precious metals, copper, other metals, energy these are all traded internationally and are fungible commodities by and large. There are a lot of strange things that have been misspoken about the difference between the wholesale and the retail market and we don’t really have the time to go over those, I think. But the fact of the latter is…
[The lights go off]
J. CHRISTIAN: Oh excuse me. I am in a building with motion sensitive lighting and it doesn’t recognize what I do as human activity.
CHAIRMAN GENSLER: Those were your words not anybody’s here.
J. CHRISTIAN: No, they were my wife’s! If you start putting position limits on bona fide hedgers for example, the bullion banks, and the previous fellow was talking about hedges of paper on paper and that is exactly right. Precious metals are financial assets like currencies, T-Bills and T-bonds they trade in the multiples of a hundred times the underlying physical and so people buying them are voting and giving an economic view of the world or a view of the economic world and so when you start saying to a bank I have a number of people… [
Note: This is mind blowing. He openly admits that the LBMA OTC market is not trading in physical gold or silver; it is trading in paper promises. Gold is not intended to be a “financial asset” like T-Bills and currencies. That is the whole point of owning it. Actual physical bullion is a tangible asset with intrinsic value that doesn’t have counterparty risk. He believes the purpose of trading paper promises in gold is for investors to “vote” on their view of the economic world! He confirms that the LBMA trades hundreds of times the real underlying physical. This is even a higher estimate than I have previously made! It is, as I asserted before the Commission, a giant Ponzi Scheme.]
J. CHRISTIAN: well, actually let’s go back to a concrete example of Mr. Organ when he was talking about August of 2008 when there was an explosion in the short positions in gold and silver held by the bullion banks on the futures market and he seemed to imply that that was somehow driving the price down. If you understand how those bullion banks run their books the reason they had an explosion in their short positions was because they were selling bullion hand over fist in the forward market, in the physical market, and in the OTC options market. Everyone was buying gold everywhere in the world so the bullion banks who stand as market makers were selling or making commitments to sell them material and so they had to hedge themselves and they were using the futures market to do that. So if you place position limits on the futures market they will have to find some other mechanism to hedge themselves …and they will. And someone else will provide that market…
M. DUNN: Jeffery, I am going to cut you off because I want to ask another question of Mr. Organ.
[It is hard to imagine more inane drivel than this. He conjures up the image of bullion bankers selling bullion like crazy to the general public who are in a feeding frenzy and the bullion bankers are “hedging themselves” by selling gold short on the COMEX!!! Did he get that idea from a blonde? A little while later Chairman Gensler also realized that this was the biggest baloney ever concocted as a cover for massive gold market manipulation by JPMorgan and HSBC in 2008 and so poses a follow up question]……
And here is the second must watch clip:
CHAIRMAN GENSLER: I would like to follow up on Commissioner Dunn’s question for Mr. Christian, if I might, because I didn’t quite follow your answer on the bullion banks. You said that the bullion banks had large shorts to hedge themselves selling elsewhere, and I didn’t understand; I might just not have followed it and you’re closer to the metals markets than me on this, but how do you short something to cover a sale, I didn’t quite follow that?
J. CHRISTIAN: Well, actually I misspoke. Basically what you were seeing in August of 2008 was the liquidation of leveraged precious metals positions from a number of places and the bullion banks were coming back to buy it, and they were hedging those positions by going short on the COMEX and that is really what it was.
[Even on a second attempt Mr. Christian invents the most ridiculous poppycock to explain away the blatant manipulation of the precious metals in 2008. If, in his own words, investors were buying gold hand over fist everywhere in the world why would leveraged long holders dump all their long holdings? They would have ordinarily been making a fortune. The bank participation report of August 2008 shows that 2 or 3 bullion banks sold short the equivalent of 25% of world annual silver production in 4 weeks and the equivalent of 10% of world annual gold production. There was simultaneously a decrease in their long positions, which were almost non-existent anyway, which is incoherent with a notion the bullion banks were mopping up dumped leveraged investments. For an intelligent and coherent explanation of what happened in August 2008 read my CFTC written testimony here]
CHAIRMAN GENSLER: So I am glad I asked because I really didn’t follow that. But if I think of the earlier charts of the positions of the bullion banks that Mr. Sherrod had these concentrated shorts have been, well you know, reasonably consistent, they are not exactly the same on every day, but his charts showed a similarity across a couple of years. So what are bullion banks, I mean I am just trying to understand, what are bullion banks hedging on the other side, we heard from other panels, but you seem to be familiar, is it warehouse receipts, what is it?
J. CHRISTIAN: Well it’s a tremendous number of things. You were at Goldman shortly after me and we had an MIS system that kicked out a daily gold book.
CHAIRMAN GENSLER: That’s really remarkable because we don’t seem to have a lot of similar views, but you know, a lot of people were at Goldman Sachs.
J. CHRISTIAN: Well I didn’t like the trends at Goldman so I left in 1986. But honestly, and bad jokes aside, if you look at a bullion bank’s book, its gold book for example, you will see an enormous number of things; there will be gold forward purchases from mining companies, there will be forward purchases from refineries, there will be gold that has been leased out to electronics manufacturers, component manufacturers, and countless manufacturers and jewelers. As gold flows through the beneficiation process and again these are all long complex issues that are hard to reduce, but you know, a lot of producers will sell their gold the moment it leaves their possession at the mine. It might be in concentrate form or it might be in dore form. It then goes to a smelter or a refinery. The bullion bank buys that and it agrees a price at the time it is buying it but it won’t be allowed to sell that metal until the refinery outturn which maybe two weeks but it could be six months. So they will go into the market and short the market in order to cover the commitment they have made to buy at that price and then when they get the metal in the physical market then they can either sell that metal in the physical market and unwind the hedge in the futures market or the forward market or do something else. There are all sorts of other derivative contracts that investment banks and bullion banks will sell to investors, to other banks, pension funds, to insurance companies and each of those will often have a long exposure in gold which will be hedged with an offsetting short position [note: There he goes again with that blonde idea that when you sell gold to someone you hedge that with a short position!]. So if you look at a bullion bank’s gold book or silver book you would find a large range of topics. One of the things that the people who criticize the bullion banks and talk about this undue large position don’t understand what is the nature of the long positions of the physical market and we don’t help it; the CFTC when it did its most recent report on silver used the term that we use “the physical market”. We use that term as did the CFTC in that report to talk about the OTC market in other words forwards, OTC options, physical metal and everything else. People say, and you heard it today, there is not that much physical metal out there, and there isn’t. But in the “physical market” as the market uses that term, there is much more metal than that…there is a hundred times what there is. If I look at the large short positions on the COMEX my question is where are the other shorts being hedged? because the short position, that I believe the bullion banks use to hedge their physicals, is larger than their short position on the COMEX and the answer is that they hedge it in the OTC market in London.
CHAIRMAN GENSLER: I thank you for that detailed discussion
END
The CFTC position limits hearing was supposed to usher in a new era of transparency and honesty into the dealings of the gold market. In a very ironic way, it did just that.
Here is Douglas' must read conclusion - and a warning for anyone who believes that following a wholesale run on commodities, investors will be able to have access to what is contractually theirs.
This is a stunning revelation. Mr. Christian confirms that the “physical market” is not in fact a physical market at all. It is a loose description of all the paper trading and ledger entries and some physical metal movements that occur each day on behalf of people who believe they own bullion in LBMA vaults but in fact they don’t. They are told they have “unallocated gold” or “unallocated silver” but that does not mean the LBMA has physical metal set aside for those customers and has just not given specific bar numbers to the customers. No, it is the most cynical and corrupt definition of “unallocated”…the customer has NO bullion allocated to him. NONE! The LBMA defines the owners of “unallocated accounts” quite clearly as “unsecured creditors”. That means they have NO collateral. NONE. Can it be any clearer? It is a giant Ponzi scheme.
Mr. Christian confirms what many analysts and GATA have been alleging that there is not much REAL physical metal, but testifies that there is actually one hundred times the REAL Physical metal being sold based on the much more “loose” definition of what “physical” means to the bullion banks.
The last sentence of his statement is mind-blowing. He says the “physical” positions of the bullion banks are so huge that they are much bigger than the COMEX short position. He says the “physicals” are hedged on the OTC market in London! Did you get that? Let me walk you through it. The bullion banks are selling what is supposed to be vault gold but it is just a ledger entry if the customer never asks for delivery. They must balance their exposure with a ledger deposit entry. This has to be some paper promise of gold from a third party, or some derivative, or even some real gold bullion. If all the ledger entries balance out then the bullion bank has no net exposure in exactly the same way the futures market works with a short offsetting a long. A futures market can never default if no one asks for delivery as only paper contracts are traded. The loosely defined “physical” London market is an identical scheme. As long as everyone is prepared to buy and sell “ledger entries” for imaginary gold in the vault no one will ever discover the fraud.
The LBMA does, however, buy and sell some real physical metal as well. But we now know form Mr. Christian’s testimony that this is one one-hundredth the size of the paper gold trading. The LBMA states on its website that it trades 20 million ozs of gold each day on a net basis. We can calculate the net trade of REAL physical gold should be about 200,000 ozs each day; that is 6.25 tonnes per day or 1625 tonnes per year. This is very much in line with the size of total global mining output of approximately 2200 tonnes per year.
So the giant Ponzi trading of gold ledger entries can be sustained only if there is never a liquidity crisis in the REAL physical market. If someone asks for gold and there isn’t any the default would trigger the biggest “bank run” and default in history. This is, of course, why the Central Banks lease their gold or sell it outright to the bullion banks when they are squeezed by high demand for REAL physical gold that can not be met from their own stocks.
Almost every day we hear of a new financial fraud that has been exposed. The gold and silver market fraud is likely to be bigger than all of them. Investors in their droves, who have purchased gold in good faith in “unallocated accounts”, are going to demand delivery of their metal. They will then discover that there is only one ounce for every one hundred ounces claimed. They will find out they are “unsecured creditors”.
GATA has long advocated the ownership of real physical bullion. The “bombshells” dropped in the CFTC Public Hearing have only served to reinforce that view. We believe we have made significant new inroads into exposing the fraud, and the suppression of precious metals prices and it is documented in the CFTC’s own hearing.
Here is a typical prodoct German wealth management bankers had to sell to clients on behalf of all big names ( from Morgan Stanley , Credit Suisse etc.) as you had some tax deductibles and made a theoretic yield if in the highest tax bracket 0f 8-10 percent per year assuming the boom would never stop. Besides the fact that those investors are screwed now it also tells the story how the real economic recovery runs- guess the chart needs no explanations. Actually this container chart puts the China boom in a very obscure spot and rather confirms the first trade deficit of China as the numbers they produced are not confirmed by container traffic at all since almost all goods from China come through container shipments.
The last 2 weeks Citi stocks exploded due to one obvious reason - if you own reminiscence of a stockoperator you will know if not its the best book one can own being in this business. A pool has been formed Paulson ,Soros and Morgan Stanley on behalf of the Treasury 8 They also own by far the biggest long position in SPY ( despite their warnings in the 800-900 zone that stocks were fragile and biased for a pullback). The have to drop around 30 bil worth of Treasury owned Citi stocks and what you do when you have to place such an incredible amount of stocks is you buy up the stock and try to fabricate a bullish case for those stocks in order to drop it on the fools who buy the scam literally.This were classic manipulation techniques decribed in the abobe mentioned book. No surprise Liesman and Cramer are covering these stock - 2 of the biggest cheerleaders and ....
Morgan Stanley has won a hotly-contested competition among Wall Street investment banks to be the underwriter and advisor on the sale of the U.S. government’s stake in Citigroup, one of the biggest stock sales in history, according to people familiar with the discussions.
Gregory Bull / AP
Morgan Stanley
The bank will be responsible for selling the government’s 27 percent stake in the bank in what is known as a “dribble-out” process that could take the rest of the year. The plan is to sell between 8 percent and 10 percent of average daily volume each day. That will likely begin after Citi reports its next earnings on April 19.
The government received the 7.7 billion of Citi
[C4.310.04(+0.94%)] shares in return for billions of dollars of aid given to the bank during the financial crisis. But the government now stands to profit. With a current price of $4.31, the shares are worth around $32 billion, which would leave the government with an $8.2 billion profit. Japan’s Nippon Telegraph and Telephone sale of $36 billion of stock in 1987 would be the only larger stock offering in history.
As the advisor, Morgan Stanley [MS28.85-0.06(-0.21%)] will be required to set up a process where the government has little discretion over timing. Sources said the government aims to create regular sales that don’t attempt to time or game the market or appear to act on inside information. But sales can be halted if the share prices drops below some price.
RELATED LINKS
Current DateTime: 07:02:25 28 Mar 2010 LinksList Documentid: 36067289
As the amount of shares decline it’s possible that a large block of as many as a 1 billion shares could be disposed of in a managed sale or sales, sources said.
It was unclear if Morgan Stanley would be the sole underwriter on the deal. Typically a bank would choose one or more partners, especially a deal this size. Details were still being worked out this weekend, but a formal announcement could come as soon as Sunday.
The government still owns trust preferred in Citi, which it received from providing insurance for the bank’s assets. Those are valued at between $3 billion to $5 billion, but are less liquid than common shares. The government also owns 10-year warrants in Citi stock.
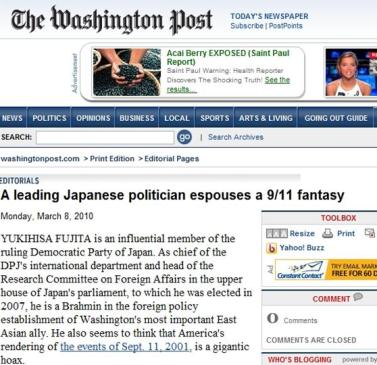
The Washington Post recently published an editorial raging against a well-respected member of the Diet of Japan, Councillor Yukihisa Fujita. The 'hit piece' titled "A leading Japanese politician espouses a 9/11 fantasy," 3/8/2010, struck me, even in this age of melodramatic sound bites, as especially baseless and exaggerated.
"Mr. Fujita's ideas about the attack on the World Trade Center…are too bizarre, half-baked and intellectually bogus to merit serious discussion," writes the Post. What are his "bizarre, half-baked and intellectually bogus" ideas about 9/11? Well, for one, Councillor Fujita "hints that controlled demolition rather than fire or debris may be a more likely explanation for at least the collapse of the building at 7 World Trade Center." The Post then wonders how a "man so susceptible to the imaginings of the lunatic fringe" could occupy such a high position in the government of a "nation that boasts the world's second largest economy" – and ends the piece by suggesting that the US-Japanese alliance, the "cornerstone" of Japan's security, could be threatened, if Prime Minister Hatoyama "tolerates elements of his own party as reckless and fact-averse as Mr. Fujita."
But who is really "reckless and fact-averse"? Councillor Fujita, in harmony with over eleven-hundred professionals associated with the Architects & Engineers for 9/11 Truth, agrees that the forensic evidence associated with World Trade Center Building 7, for example, corroborates the explosive controlled demolition hypothesis. And, that it contradicts the government's hypothesis (espoused by only a dozen NIST team members) that normal fires primarily brought the building down. And so he is also calling for a new investigation. So, are his ideas "half-baked"? Let's reiterate some of the many relevant facts about Building 7 and the Twin Towers:
1. WTC 7, a 47 story skyscraper, not hit by an airplane, collapsed at nearly free-fall acceleration in under 7 seconds; this is only about a second more than the time it would take a bowling ball to drop from the roof to the ground.
2. WTC 7 collapsed vertically, symmetrically, and neatly into its own footprint.
3. Numerous credible witnesses heard explosions.
4. The steel-framed structure was almost completely dismembered; as pyroclastic-like clouds carried thousands of tons of pulverized concrete away. Several tons of molten iron were found under the debris pile, but office fires can't melt steel or iron. Where did the molten iron come from? FEMA finds and documents "evaporated" beam ends like "Swiss cheese" in their Appendix C of the BPAT report in May 2002, and evidence that can only be explained by thermite – an incendiary used to cut through steel like a hot knife through butter. Thermite releases molten iron at 4,500° F.
6. Scientists found previously molten iron microspheres in all of the dust samples throughout lower Manhattan (evidence of what must have been billions of microspheres) as well as actual chips of undetonated nano-thermite composite explosives, and published these findings in a peer-reviewed scientific journal.
The "fire and debris" hypothesis explains none of this evidence, while the controlled demolition hypothesis explains all of it. And yet The Washington Post calls Councillor Fujita's position "bizarre, half-baked, intellectually bogus," the product of the "lunatic fringe," and "reckless and fact-averse." Who here is truly averse to the facts? We don't expect The Washington Post to agree with the implications of the scientific evidence regarding the collapse of Building 7 – but a newspaper of its stature should at least be willing to look at and report the evidence. The Post's omission here may in fact be evidence of a continuing cover-up of an extremely serious crime that Councillor Fujita is seeking to expose.
This murder attempt is a clear signal that the story of the silver manipulation was on the spot and now a full blown investigation is due but as before this story has no mass media coverage at all. This stinks at all ends and shows how rotten the system is - everone should forward this to his representative and ask for imediate action.
excerpt
You Don't Mess With The LBMA - Assassination Attempt On Silver Market Manipulation Whistleblower?
London metals trader Andrew Maguire, who warned an investigator for the U.S. Commodity Futures Trading Commission in advance about a gold and silver market manipulation to be undertaken by traders for JPMorgan Chase in February and whose whistleblowing was publicized by GATA at Thursday's CFTC hearing on metals futures trading was injured along with his wife the next day when their car was struck by a hit-and-run driver in the London area.
According to GATA's contact with Maguire, board member Adrian Douglas, Maguire and his wife were admitted to a hospital overnight and released today and are expected to recover fully.
Maguire told Douglas by telephone today that his car was struck by a car careening out of a side road. When a pedestrian who witnessed the crash tried to block the other driver's escape, the other driver accelerated at the pedestrian, causing him to jump out of the way to avoid being hit. The other driver's car then struck two other cars in escaping. But the other driver was caught by police after a chase in which police helicopters were summoned.
We'll convey more information about the incident as it becomes available.
We are in process of corroborating this story with independent sources. It will be interesting to see what information the escapee driver discloses and whether this was just a case of a little extra fish and chips and extra, extra beer. In the meantime, the battle against the big banks and the LBMA might have just gotten a little more personal.
2. not even one of the mass media controlled by the Rothschild Rockefeller gang reported about the Gold Silver manipulations which confirms that a huge scam is running ( again).
Its only a repetition of a pattern we had back in the 20's to 30's when england cancelled suddenly the Gold standard and let the Sterling drop forcing the reserve currency of those times to crash and with them the bonds - followed by Roosevelt stealing peoples money by confiscating Gold after everybody fled from Sterling to Gold. In todays terms trillions were destroyed by this Rothschild scam and they likely made that money since who knew that would happen could make a unbelievable fortune by shorting Gold.
read the excellent research in below link http://www.scribd.com/doc/24251265/Thunder-Road-Report-18-17th-December-2009
3. Finally a secret time bomb is already destroying billions of balance sheets which are not disclosed yet. 1 tril of this swaps on the wrong side will have cost about 80 BP or 8 bil - we are talking around 200 bil of losses but it rather could reach 1 tril.- just for the record the ones who win will be mostly corporations as they likely will be on the winning end of these trades. I recommend to read the full article
excerpt 1
And when looking at IR holdings by bank, it would seem that JPM, Goldman, Bofa, and Citi are most impacted. While JPM, GS, BofA, Citi and Wells have about $131 billion in IR swaps among them, more relevantly, JPM, Goldman and BofA have $9, $7 and $5 trillion in >5 year IR swaps. This is very troubling.
excerpt 2
More Than Meets The Bottom Line: Are Banks Getting Crushed Due To Negative Swap Spreads And The $154 Trillion IR-Derivative Market?
Submitted by Tyler Durden on 03/26/2010 14:46 -0500
Lots of confused chatter in the bond community as to why the negative swap spread story (anywhere between 7Y and 30Y) is being largely ignored by the media. After all, the associated market, which according to the BIS was roughly $154 TRillion in June 30 makes the Greek bond debacle and various sovereign CDS discussions in the media pale in comparison. As several bond traders pointed out, the likelihood of negative spreads having been modelled out by the TBTFs is very low, if any, meaning that unhedged bank IR-swap exposure is suffering massively, and is likely to surpass all record past prop desk losses. In fact, rumors abound that a few of the desks having placed leveraged bets on spread divergence over the past months and years are currently in critical condition, yet nobody is discussing this for fear of another round of bank run concerns among the TBTF banks. What is odd, is that the Primary Credit borrowings are now at almost financial crisis lows of just under $9 billion, leading many to speculate that banks now satisfy all of their short-term funding needs via the fungibility of excess reserves (and indicating once again that the Fed's discount rate hike was the most irrelevant action in a history of irrelevant actions). And just in case there is still confusion as to what negative swap spreads mean, here is a useful primer.
From Morgan Stanley:
The big news is that 10y swap spreads (Swap Spread = Libor Rate - UST Yield; e.g. 10yr swap spread = 10yr Libor Rate - UST 10yr yield. This spread has always been positive, today it is negative implying that UST 10y yields have risen above 10y Libor rates) have fallen below zero (Exhibit 1). But the bigger questions are how do we define value in spreads and how much more inverted can 10y spreads go? At the height of the crisis in 4Q08, 30y swap spreads got to -41bps and have remained inverted ever since. The inversion of 30y spreads had more to do with technical, exotic and hedge-related factors. But those elements are missing from the inversion of 10y spreads. That's what makes it interesting. Today we view the inversion in 10y swap spreads as a harbinger of the massive supply of UST debt that will ultimately drive yields higher.
What drives swap spreads?
Back in the late 1980's and early 1990's, swaps were a ground-breaking innovation. It was a “magic formula” to turn long-term liabilities into short-term liabilities. ABC Company would issue (that is, pay an interest rate) on, say, 10yr debt in the market, then receive a 10yr fixed interest rate in the Libor market while simultaneously paying a 3-month floating Libor rate (Exhibit 2). And voila, ABC Company 'swapped' a long-term fixed liability for a cheaper and easier to manage short-term liability. Magic! But things were simpler in days of yore. Swaps were a less volatile vehicle used by corporations to manage cash flows on their debt. They used swaps because they could customize the end dates of their fixed cash flows, rather than relying on US Treasuries with their pesky issuance cycles and inherent technicalities. For example, 10y spreads from 1992–1997 trade in a range from 28bps to 41bps, pretty narrow. But this simplicity allowed us to understand what drove swap spreads. These factors were primarily:
The spread between Libor and repo rates
The slope of the yield curve
The US deficit and UST supply
The first point argued that Libor rates should be higher than UST rates because there was a 'repo-specialness' premium between UST’s and Libor. The second point refers to corporate issuance: if the curve steepens, then corporations are more likely to swap their long-term liabilities at higher rate levels into short-term liabilities at lower rate levels. The last point refers to the relative level of UST issuance. If the US economy slows and goes into a deficit, then the US will issue more Treasuries to fund itself, therefore narrowing swap spreads (Exhibit 3). Currently, we have a high 9.9% deficit to GDP ratio and correspondingly, a $2.4Tr gross issuance of UST’s in 2010.
What has changed?
Later in the 1990s and over the last decade, the swaps market took on increased importance not just as a hedging vehicle but also as a speculative vehicle. What drove swaps over the past 10 years has been hedging the interest rate sensitivity in mortgages. But today, a case can be made that mortgages are less interest rate sensitive than in the past (i.e., less negatively convex). The reason is that households may be less able to refinance their mortgages for a given change in interest rates, because refinancing is more related to FICO scores, credit availability, loan-to-value, incomes, etc. We believe swap spreads will narrow and remain inverted as interest rates have stayed low and stable, volatility has fallen, spread products have been narrowing, and there is little hedge-related need to pay fixed in swap. Add to that the old-time reasons, which are becoming more popular drivers of swap spreads today, of reduced specialness premiums, tighter repo-Libor spreads, steeper yield curves and monstrous US Treasury supply. All of which become the contributors to 10y swap spreads moving negative. Oddly, the tight level of swap spreads is a look back into the future. But the inversion of spreads is the new twist.
Morgan Stanley's conclusion is that, independently of our concerns, US Treasury rates are about to spike. To be sure, MS has been pushing for high rates and major curve steepending for a while: recall it is their call that the 10 Year will hit 5.5% this year.
The issuance of UST debt is dwarfing Libor-related issuance. For example, we expect UST net issuance to be $1.7Tr and net issuance of MBS to be zero. Thus, the relative issuance of UST’s vs. Libor-based products mainly accounts for the inversion in swap spreads. This is a first sign of stress leading to higher UST yields and is not to be missed.
And back to our question: is there currently a massive P&L hit to some or all of the Big 5 US banks as a result of this very much unexpected inversion? While surely the full $154 trillion or so amount is not applicable to the 7Y+ inversion, the OCC as of its most recent report does indicate that there is $27 Trillion in Interest Rate swaps outsanding with a maturity greater than 5 years.
And when looking at IR holdings by bank, it would seem that JPM, Goldman, Bofa, and Citi are most impacted. While JPM, GS, BofA, Citi and Wells have about $131 billion in IR swaps among them, more relevantly, JPM, Goldman and BofA have $9, $7 and $5 trillion in >5 year IR swaps. This is very troubling.
Maybe some of those fantastic financial analysts who were telling the general public to buy Lehman a few days before its bankruptcy, and are now saying financial companies will quadruple over the next few years, can do something useful for a change and ask the executive teams of the above mentioned banks 1) how big their exposure to negative swap spreads is and 2) what the negative P&L impact as a result of this unprecedented spread inversion is?


 The Washington Post recently published an editorial raging against a well-respected member of the Diet of Japan, Councillor Yukihisa Fujita. The 'hit piece' titled "